

Understanding enrollment trends
SDoL’s preliminary enrollment was 9,445 students on October 1, 2026, down 1,765 students since 2017. This represents a decline of nearly 16%.
Long-range projections anticipate continued declines, meaning the district could be 25% smaller in 2032 than it was in 2017.
The district must therefore consider how its schools will serve students in the coming years as well as today.
The projections mirror the trends in similar school districts.
October 2026 enrollment figures are preliminary and have not been finalized by the Pennsylvania Department of Education, but we can see how the actual count compares to the projections.
A decrease of this size changes how much classroom space the district needs and how efficiently it can operate its buildings.
The district uses enrollment projections prepared by Cropper GIS as part of its facilities planning. The February 2026 study projects elementary enrollment declining from 4,662 students in 2025–26 to 4,377 in 2035–36. Middle school enrollment is projected to decline from 2,072 to 1,840 during the same period.
These figures describe elementary and middle school enrollment, rather than total district enrollment. They use an October 2025 baseline and are separate from the preliminary October 2026 count.
Projections are estimates that help the district evaluate future needs. Actual enrollment may differ, and planning should continue to account for updated counts.
Understanding what’s driving the decline
Declining birth rates, more families moving out than moving in, and increasing housing costs are contributing to changes in enrollment.
Families are having fewer children, and a smaller percentage of children being born ultimately enroll in SDoL than 10 years ago.
The February 2026 Cropper GIS study identified families with children moving out of the district as the primary driver of projected enrollment decline over the next decade.
When more families with children move out than move in, fewer students enroll. Lower birth rates can also reduce the number of children entering kindergarten in future years, while housing costs influence where families can afford to live.
These findings help the district look beyond a single year’s enrollment when evaluating future classroom needs. They provide context for long-range planning, although they cannot predict every change within an individual school or neighborhood.
It's becoming more difficult to find affordable housing in Lancaster City and Lancaster Township.
According to census data, the number of housing units in SDoL is virtually unchanged over the past decade.
As families get smaller, that means fewer students overall and more demand for family housing. That is why home values have doubled and median rent has grown by 50% over the same time span.
Making better use of our school buildings
Average elementary school utilization was 78.1% in October 2026. Average middle school utilization was 63.4%, indicating substantial available capacity across the district.
Building utilization compares student enrollment with a school’s calculated capacity.
Average elementary utilization declined from 80.6% in October 2025 to 78.1% in October 2026. Average middle school utilization declined from 64.8% to 63.4% during the same period.
These averages indicate that the district operates more space than its current enrollment requires. Available capacity varies by school, however, and a districtwide average does not describe the conditions in every building.
Utilization measures how space is used. It does not measure school quality, student performance or the value of a school to its community.
School buildings require utilities, maintenance and custodial services even when fewer students attend.
A decline in enrollment does not automatically produce an equivalent reduction in those expenses.
Reviewing available space helps the district evaluate whether students could be served effectively in fewer buildings. Any potential savings must account for expenses that continue when students and services move to receiving schools.
Event after the closure of Price and Wheatland, demographers at Cropper GIS estimate the district’s schools will be, on average, significantly under-utilized in 10 years.
Planning for the spaces students need
Lower overall enrollment does not mean every type of classroom space is available where it’s needed. Facilities planning must account for specialized instruction and student services.
Even as the district's enrollment declines, a larger share of students qualify for special education and English language services.
The district’s facilities analysis identifies increasing needs for special education spaces even as overall enrollment declines.
Planning must consider how rooms are used, where programs are located and whether available space can accommodate students’ instructional needs. A specialized classroom cannot automatically be treated as an available general education classroom.
These considerations help explain why enrollment totals and building capacity must be evaluated alongside program needs.
Based on PA Department of Education guidelines, the district estimates a typical classroom can accomodate 25 students.
Actual classroom use depends on grade level, instructional needs and program requirements. Student assignments, staffing and program locations require further planning as recommendations develop.
Considering the condition of our buildings
Facilities assessments examine building systems, accessibility and safety, along with how well school spaces support teaching and learning.
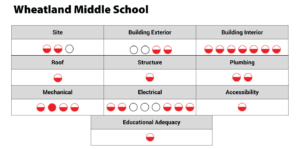
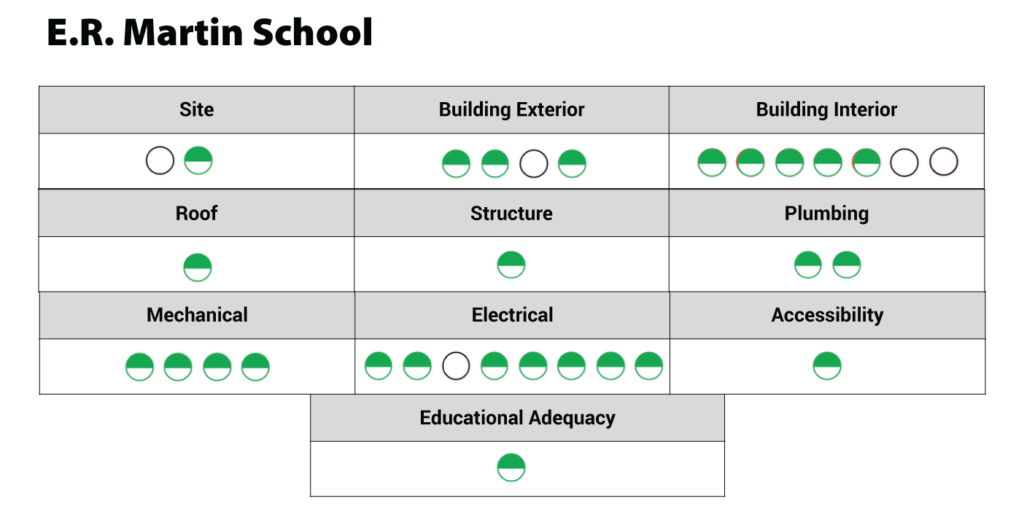
The district’s facilities review examines 32 components of each building, including roofs, plumbing, electrical systems, heating and cooling, and interior and exterior spaces.
Each component is rated on a five-point scale:

These assessments help identify maintenance needs and limitations that could affect a building’s future use. The findings inform comparisons between improving an existing school, constructing a new facility or using available space elsewhere.
Wheatland, which has not been significantly renovated since it was built in 1955, compares unfavorably to E.R. Martin, built in 2013.
The study identified limitations at the Wheatland building and site, alongside the opportunity to use Martin as a middle school in the western part of the district.
A new Wheatland Middle School carried an estimated construction cost of $85.9 million as of September 2026. Using an existing facility would avoid that proposed construction project.
The construction estimate is not an annual savings figure. Evaluating the recommendation also requires accounting for any conversion work at Martin, transportation and other transition expenses. The proposed school changes are explained on The Plan page.
Understanding the financial challenge
The district’s financial projections show expenses continuing to exceed revenue, even under scenarios that include additional tax revenue and state funding.
The district does not have the taxing capacity to keep pace with current expenses.
Local real estate taxes are the only revenue source the school board can control, but they provide only about 30% of the district’s revenue. State funding and other revenue sources follow different rules and funding decisions.
For about 10 years, from 2015-2024, the school board rasied taxes below the rate of inflation and well below its full taxing authority allowed by law. Like interest on a bank account, revenue that the district does not receive in one year compounds over time.
Existing debt payments also use a portion of new tax revenue. As a result, a tax increase does not make all of the additional money available for instruction or other operating needs.
Absent any changes to the status quo, the district faces a cumulative deficit of $90 million over the next five years.
The district examined nine combinations of local tax increases and state funding assumptions. Each produces a cumulative deficit over the five-year forecast.
These projections indicate that additional revenue alone does not close the modeled gap. The district must also evaluate its ongoing expenses, including the cost of operating and maintaining its school buildings.
Financial forecasts depend on assumptions about future revenue and expenses. Those assumptions should accompany the figures so readers can understand what each scenario represents.
What is the difference between an annual deficit and a cumulative deficit?
An annual deficit is the amount by which projected expenses exceed projected revenue in one fiscal year.
A cumulative five-year deficit adds the projected gaps across all five years. It should not be described as a single year’s shortfall or as the district’s current debt.
Keeping these measures separate helps explain the scale and timing of the financial challenge.
Understanding how facilities changes could help
Operating fewer buildings can reduce certain ongoing expenses. Using available space more effectively can also help the district avoid some future construction costs.
The district can save some, but not all, of the operational costs of a school by closing it.
The fixed costs of operating and maintaing a school building go away if the school district no longer operates the facility. These costs are things like utilities, supplies, and maintenance cost. Some staff become duplicative also. For example, one school does not need to principals.
However, a school’s operating budget includes expenses that may continue at another location. Moving students does not eliminate the need to educate them or provide their services.
A reliable savings estimate must distinguish costs that end from costs that transfer to another school. It must also account for any new transportation, facility conversion and transition expenses.
Buildings continue to require maintenance as they age, even when enrollment declines.
Delaying a decision does not remove those obligations or the cost of operating available space.
The district must weigh those pressures alongside the effects school changes would have on children and families. The projections establish a need to evaluate options without determining every decision on their own.
Selling property and avoiding new construction can save the district millions of dollars.
Property sales provide a one-time source of funds. They do not create recurring annual revenue.
At the same time, avoiding the costs of new construction–for example by building a new Wheatland Middle School–can help the district avoid up to $90 million in new debt, not including interest.
Explore the recommendations and share your questions
Understanding the challenges is the starting point.
Review the recommended school changes, learn about the proposed timeline and participate in the conversations that will inform the district’s next steps.
Families can attend a community conversation or submit a question about the recommendations and their potential effect on students.